- Ethereum’s current trading near the 20-day moving average suggests potential consolidation.
- Whale activity is increasing, with 48,687 ETH transferred to Kraken this year, indicating profit-taking.
Ethereum is currently trading at $3,397.46, reflecting a daily surge of 1.91%. Its market capitalisation stands at $409.28 billion, maintaining its position as the second-largest cryptocurrency. Over the last 24 hours, trading volume increased by 37.13% to $13.35 billion, resulting in a volume-to-market cap ratio of 3.29%.
A significant whale activity was observed, with a transfer of 3,370 ETH worth $11.37 million to Kraken. The whale who received 200,000 ETH from the Ethereum Genesis Block in 2015 has sent 48,687 ETH to Kraken this year, with an average transfer price of $3,528. This suggests profit-taking amid market fluctuations. The wallet still holds 7,594 ETH, valued at $25.72 million, indicating potential for further market influence.
What’s Next for ETH?
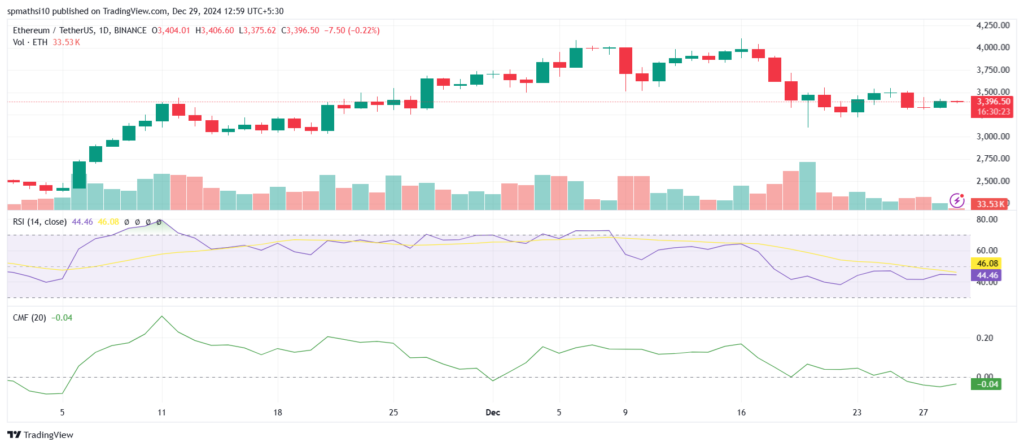
On the daily chart, Ethereum is hovering near a critical support level of $3,375. If this level breaks, the price may drop towards $3,200. Conversely, resistance lies at $3,525, and a breakout above this level could propel Ethereum to $3,750 in the near term.
The Relative Strength Index (RSI) is at 44.46, indicating neutral market sentiment but leaning toward oversold territory. The RSI average at 46.08 suggests limited momentum, but a potential upward move if buying pressure increases.

The moving averages indicate mixed signals. The 50-day moving average is trending below the 200-day moving average, signalling a bearish sentiment. However, the price trading near its 20-day moving average suggests a potential consolidation phase. A bullish crossover of shorter-term averages above longer-term ones would be a strong signal for a price surge.
The Chaikin Money Flow (CMF) currently reads -0.04, reflecting weak capital inflows. Negative money flow suggests declining investor confidence and potential selling pressure in the short term.
Ethereum’s technicals point to cautious market behaviour. The RSI and CMF indicate low momentum and declining capital inflows. Traders should monitor the $3,375 support and $3,525 resistance levels closely. A break above resistance could signal bullish momentum, while a dip below support may indicate further bearish pressure.
Highlighted Crypto News Today
Will Bitcoin Bulls Overcome Key Levels and Trigger a Breakout?


