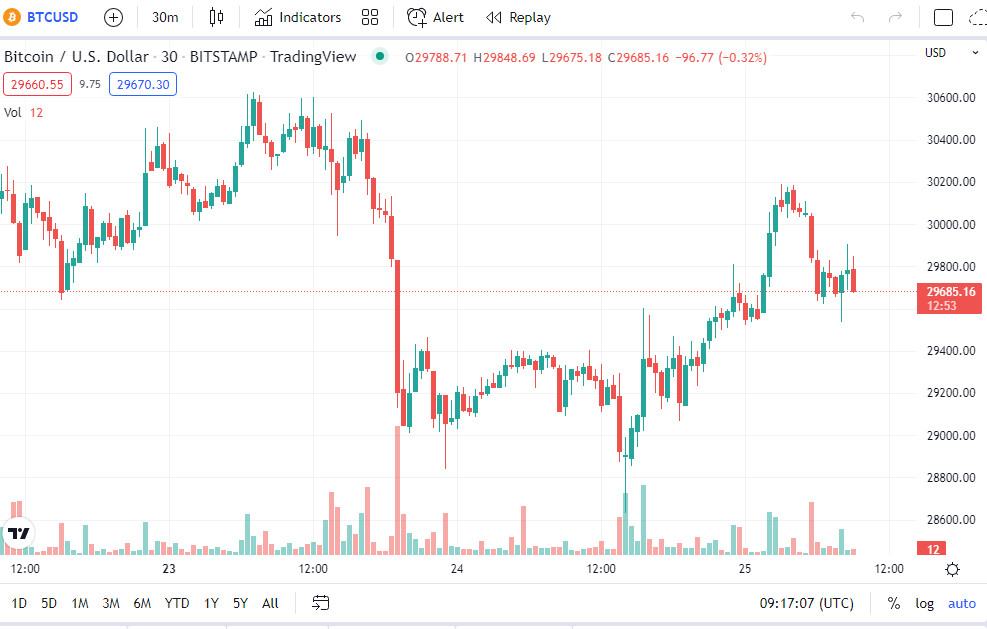
- There was strong support and rejection at $29,000 in today’s Bitcoin price analysis.
- Bitcoin is up 2.01% in the last 24 hours.
In the last couple of days, the price of bitcoin continued to fall below the support level of $29,500. However, there was some activity by bulls at the $28,500 support level. A new base was established at $28,600, and the price began a new upward movement. The $29,200 and $29,500 resistance levels had been broken. When the price moved down from $30,630 to $28,635, it broke the 50% Fibonacci retracement level.

Bulls Are Anticipated to Dominate
On the hourly chart of the BTC/USD pair, a key bearish trend line with resistance at $29,800 was broken. The price of Bitcoin has crossed over the $29,500 barrier and the 100-hour simple moving average.
The decline from the swing high of $30,630 to the low of $28,635 has a 76.4 percent Fib retracement level. This threshold of $30,600 serves as the next significant barrier. A decisive breakout over the $30,600 barrier is needed for the market to continue to rise. If the above scenario plays out, the price may break over the $31,200 resistance level.
The 100-hour simple moving average and the $29,500 level serve as the first significant support. The price might fall even more if it breaks below the $29,500 support level. The bulls are anticipated to take a firm stance at the $28,500 level, where the primary support resides.
There was strong support and rejection at $29,000 in today’s Bitcoin price analysis, suggesting that further declines are improbable. This means that Bitcoin/USD is predicted to grow higher in the following days, most likely to the $31,000 mark. According to CMC, the Bitcoin price today is $29,833.17 USD with a 24-hour trading volume of $28,091,309,522 USD. Bitcoin is up 2.01% in the last 24 hours.


